|
|
||||||||||||||||||||||||||||||||||||||||||||||||||||||
|
Hallways4 > Help & Support Center > Documentation Module > Accountability Reports > Program Impact
|
|
|||||||||||||||||||||||||||||||||||||||||||||||||||||
|
|
||||||||||||||||||||||||||||||||||||||||||||||||||||||
|
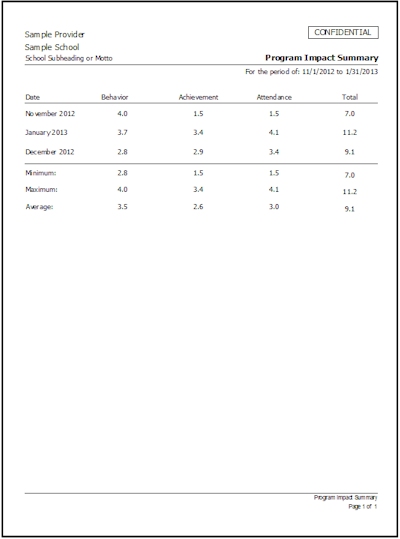
The Program Impact Summary shows the average student performance levels in the three categories of behavior, achievement, and attendance, as well as the total average. Data is grouped by each month occurring during the specified date range. The report also shows the minimum, maximum and average for each category and the total across all categories. If the report doesn’t open, there is no data for the selected date range.
|
||||||||||||||||||||||||||||||||||||||||||||||||||||||

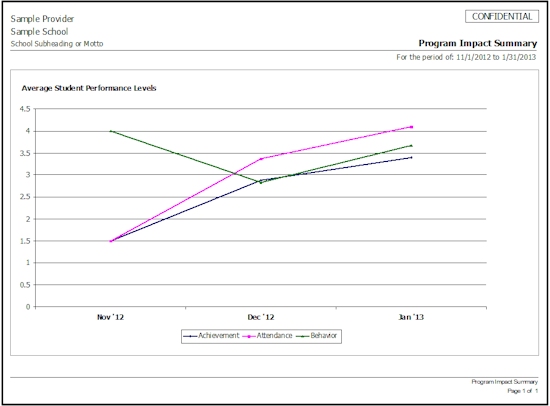
 The
Program Impact Summary Chart is a trend chart, intended to show data
over the course of several months. The average student performance
levels in all three categories are marked over the course of the
specified time period.
The
Program Impact Summary Chart is a trend chart, intended to show data
over the course of several months. The average student performance
levels in all three categories are marked over the course of the
specified time period.